Data Mining Basics
Objective 1
Familiarize with vector operations for manipulating multi-dimensional arrays in numpy.
- Using numpy, initialize two arrays (1000 rows, 50 and 10 columns) of random numbers each number ranging between 0 and 1;
- Create the correlation matrix (shape=[1000, 1000]) of pearson correlations between all pairs of rows from above;
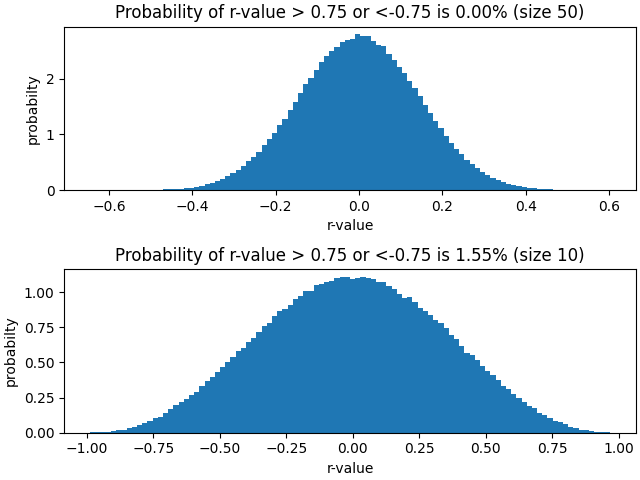
- Using matplotlib, plot a 100-bin histogram, using values from lower triangle of \(1000\times1000\) correlation coefficient (r-values) matrix obtained from above (omit the diagonal and all cells above the diagonal);
- Using the histogram, estimate the probability of obtaining an r-value > 0.75 or < -0.75 from correlating two random vectors of size 50 and 10.
import numpy as np
import matplotlib.pyplot as plt

num_row = 1000
num_cols = [50, 10]
num_bins= 100
idx_low = np.tril_indices(num_row, -1)
fig, axs = plt.subplots(2, constrained_layout=True)
for idx, col in enumerate(num_cols):
    arr = np.random.rand(num_row, col)

    corr_mat = np.corrcoef(arr)

    low_tri_arr = corr_mat[idx_low]
    hist, bin_edges = np.histogram(low_tri_arr, bins=num_bins, density=True)
    indices = np.logical_or(bin_edges[:-1]<-0.75, bin_edges[:-1]>0.75)

    est = np.sum(hist[indices] * np.diff(bin_edges)[indices])

    axs[idx].hist(low_tri_arr, bins=num_bins, density=True)
    axs[idx].set_title('Probability of r-value > 0.75 or <-0.75 is {:.2f}% (size {})'.format(est*100, col))
    axs[idx].set(xlabel='r-value', ylabel='probabilty')

plt.show()

The histogram is shaped like a gaussian.
Objective 2
Basic data visualization (scatter plots and line charts).
- Get the Linnerrud dataset (import using:
from sklearn.datasets import load_linnerud). Weight, waist, and heartrate are attributes, chinups, situps, and jumps are outcomes; - Using numpy matrix functions (
np.dot,np.transpose, etc), compute the linear-least-square solution, finding the intercept and slope of best fit line for each [attribute, outcome] pair (attribute on x-axis, outcome on y-axis). Make sure to augment the attribute vectors with a column of 1’s, so LLS can find the intercept.
import numpy as np
import matplotlib.pyplot as plt
from sklearn.datasets import load_linnerud

(data, target) = load_linnerud(return_X_y=True)

x_weight = target[:,0]
x_waist = target[:,1]
x_heartrate = target[:,2]

y_chinups = data[:,0]
y_situps = data[:,1]
y_jumps = data[:,2]

A_weight = np.vstack([x_weight, np.ones(len(x_weight))]).T
A_waist = np.vstack([x_waist, np.ones(len(x_waist))]).T
A_heartrate = np.vstack([x_heartrate, np.ones(len(x_heartrate))]).T

m1, c1 = np.linalg.lstsq(A_weight, data, rcond=None)[0]
m2, c2 = np.linalg.lstsq(A_waist, data, rcond=None)[0]
m3, c3 = np.linalg.lstsq(A_heartrate, data, rcond=None)[0]

fig, axs = plt.subplots(3, 3, constrained_layout=True)

axs[0, 0].plot(x_weight, y_chinups, 'o')
axs[0, 0].plot(x_weight, m1[0]*x_weight + c1[0])
axs[0, 0].set_title('Slope: {:.2f}\nIntercept: {:.2f}'.format(m1[0], c1[0]))
axs[0, 0].set(xlabel='weight', ylabel='chinups')

axs[0, 1].plot(x_weight, y_situps, 'o')
axs[0, 1].plot(x_weight, m1[1]*x_weight + c1[1])
axs[0, 1].set_title('Slope: {:.2f}\nIntercept: {:.2f}'.format(m1[1], c1[1]))
axs[0, 1].set(xlabel='weight', ylabel='situps')

axs[0, 2].plot(x_weight, y_jumps, 'o')
axs[0, 2].plot(x_weight, m1[2]*x_weight + c1[2])
axs[0, 2].set_title('Slope: {:.2f}\nIntercept: {:.2f}'.format(m1[2], c1[2]))
axs[0, 2].set(xlabel='weight', ylabel='jumps')


axs[1, 0].plot(x_waist, y_chinups, 'o')
axs[1, 0].plot(x_waist, m2[0]*x_waist + c2[0])
axs[1, 0].set_title('Slope: {:.2f}\nIntercept: {:.2f}'.format(m2[0], c2[0]))
axs[1, 0].set(xlabel='waist', ylabel='chinups')

axs[1, 1].plot(x_waist, y_situps, 'o')
axs[1, 1].plot(x_waist, m2[1]*x_waist + c2[1])
axs[1, 1].set_title('Slope: {:.2f}\nIntercept: {:.2f}'.format(m2[1], c2[1]))
axs[1, 1].set(xlabel='waist', ylabel='situps')

axs[1, 2].plot(x_waist, y_jumps, 'o')
axs[1, 2].plot(x_waist, m2[1]*x_waist + c2[1])
axs[1, 2].set_title('Slope: {:.2f}\nIntercept{:.2f}'.format(m2[2], c2[2]))
axs[1, 2].set(xlabel='waist', ylabel='jumps')


axs[2, 0].plot(x_heartrate, y_chinups, 'o')
axs[2, 0].plot(x_heartrate, m3[0]*x_heartrate + c3[0])
axs[2, 0].set_title('Slope: {:.2f}\nIntercept: {:.2f}'.format(m3[0], c3[0]))
axs[2, 0].set(xlabel='heartrate', ylabel='chinups')

axs[2, 1].plot(x_heartrate, y_situps, 'o')
axs[2, 1].plot(x_heartrate, m3[1]*x_heartrate + c3[1])
axs[2, 1].set_title('Slope: {:.2f}\nIntercept: {:.2f}'.format(m3[1], c3[1]))
axs[2, 1].set(xlabel='heartrate', ylabel='situps')

axs[2, 2].plot(x_heartrate, y_jumps, 'o')
axs[2, 2].plot(x_heartrate, m3[2]*x_heartrate + c3[2])
axs[2, 2].set_title('Slope: {:.2f}\nIntercept: {:.2f}'.format(m3[2], c3[2]))
axs[2, 2].set(xlabel='heartrate', ylabel='jumps')

plt.show()

Objective 3
To understand the basic machine learning algorithms, here I implement the following two algorithms, from scratch, in python (using only numpy import). And test these algorithms on the Linnerrud dataset (import using: from sklearn.datasets import load_linnerud) using all 3 attributes, and only the chinups outcome. Define new vector assigning binary classes to the outcome of chinups as follows:
if (chinups > median(chinups)) then chinups = 0 else chinups = 1
import numpy as np
from sklearn.datasets import load_linnerud

(data, target) = load_linnerud(return_X_y=True)

chinups = data[:,0]
median = np.median(chinups)
chinups = np.where(chinups > median, 1, 0)
then use these classes to build the probability table and train the perceptron.
Gaussian Naive Bayes
Gaussian Naive Bayes is a probabilistic modeling algorithm.
- Gaussian Naive Bayes (probabilistic modeling)
class GNB():
    def __init__(self):
        self._mu0 = []
        self._mu1 = []
        self._sigma0 = []
        self._sigma1 = []
        self._prior = {}

    def _prior_prob(self, y):
        unique, counts = np.unique(y, return_counts=True)
        prob = counts/len(y)
        return dict(zip(unique, prob))

    def fit(self, X, y):
        self._mu0 = np.mean(X[y==0], axis=0)
        self._mu1 = np.mean(X[y==1], axis=0)
        self._sigma0 = np.std(X[y==0], axis=0)
        self._sigma1 = np.std(X[y==1], axis=0)
        self._prior = self._prior_prob(y)

    def pred(self, x):
        x0 = x
        x1 = x
        probs0 = np.ones(x.shape)
        probs1 = np.ones(x.shape)
        for i in range(x.shape[1]):
            gaussian0 = lambda x: 1/(np.sqrt(2*np.pi)*self._sigma0[i])*np.exp((-(x-self._mu0[i])**2)/(2*self._sigma0[i]**2))
            gaussian1 = lambda x: 1/(np.sqrt(2*np.pi)*self._sigma1[i])*np.exp((-(x-self._mu1[i])**2)/(2*self._sigma1[i]**2))
            v_gaussian0 = np.vectorize(gaussian0)
            v_gaussian1 = np.vectorize(gaussian1)
            probs0[:,i] = v_gaussian0(x0[:,i])
            probs1[:,i] = v_gaussian1(x1[:,i])

        likeli0 = np.prod(probs0, axis=1)*self._prior[0]
        likeli1 = np.prod(probs1, axis=1)*self._prior[1]
        post = likeli1 / (likeli0+likeli1)
        return post
gnb = GNB()
gnb.fit(target, chinups)
outputs = gnb.pred(target)
print(((outputs > 0.5) == chinups).sum() / len(chinups))
0.7
Perceptron
Perceptron learning rule is linear modeling algorithm.
class Perceptron(object):
    # if perceptron does not converge run for 1000 iterations
    def __init__(self, iters=1000):
        self._iters = iters
        self._weights = []

    def fit(self, X, y):
        # set all weights to zero
        self._weights = np.zeros(X.shape[1]+1)
        # until all instances in training set are correctly classified
        # or run enough iterations
        for _ in range(self._iters):
            y_pred = self.pred(X)
            y_pred = y_pred>0
            if np.all(y_pred==y):
                break

            for inst, label in zip(X, y): # for each instance
                pred = self._pred(inst)
                if pred != label: # if inst is classed incorrectly
                    # if inst belongs to first class, add to weight vec
                    # else subtract it from weight vec
                    self._weights[1:] += (label - pred) * inst
                    self._weights[0] += (label - pred)

    def _pred(self, inst):
        prediction = np.dot(inst, self._weights[1:]) + self._weights[0]
        if prediction > 0:
            prediction_class = 1
        else:
            prediction_class = 0
        return prediction_class

    def pred(self, x):
        weighted_sums = np.dot(x, self._weights[1:]) + self._weights[0]
        return weighted_sums
perceptron = Perceptron()
perceptron.fit(target, chinups)
outputs = perceptron.pred(target)
print(((outputs > 0) == chinups).sum() / len(chinups))
0.5