MRI Image Viewer
All these images were taken from OpenNeuro. Use the nibabel libraries to load images from disk. Here we use Python and Numpy libraries. There 5 separate modalities of 3D MRI images as follows:
- T1-weighted (t1.nii)
- T2-weighted (t2.nii)
- Susceptibility-weighted (swi.nii)
- Time of flight angiogram (tof.nii)
- Blood oxygen level dependent (bold.nii)
.nii is a medical imaging format (nifti format).
Python viewer
Create a viewer function in Python that displays a slice from a 3D image and allows for scrolling through the images slices using keypad or mouse wheel. A call to viewer(t1_data, index=250, view='coronal') produce the following image:
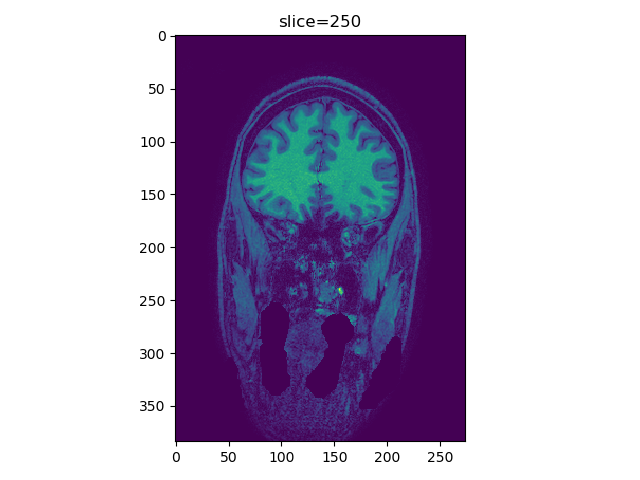
t1_data is a 3D numpy array with the z-slices in the \(3^\text{rd}\) dimension (most images are structured this way). We can rotate the mouse wheel, or press the ‘up’ or ‘down’ arrow keys, the image will change to a different slice. Here uses of the Matplotlib.
Add histogram equalization option histeq, call viewer(t1_data, index=250, view='coronal', histeq=True) will produce a histogram-equalized image in the viewer, instead of the raw image.
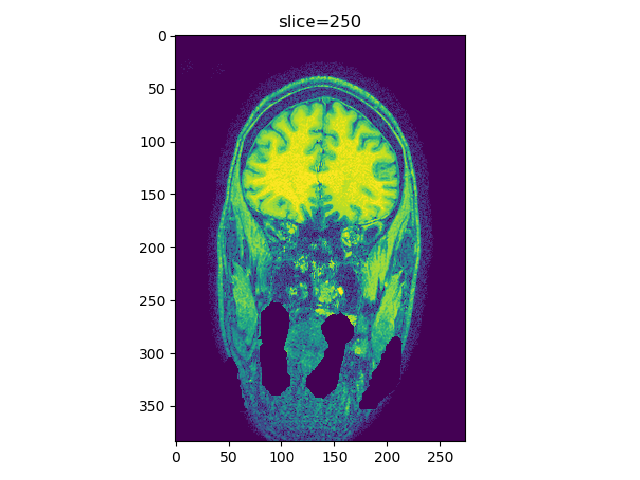
Add an option to display all viewers simultaneously in the same plot using sub-plots. When place the mouse over one of the subplots and rotate the mouse wheel, only the selected subplot slice will change. viewer(t1_data, index=250, view='all'):

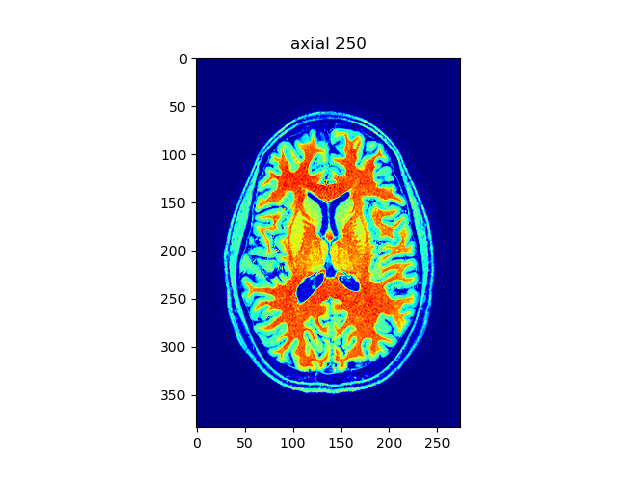
We can also see the need for histogram equalization in sagittal/coronal view (blood vessels are too bright relative to the rest of the tissue). Also add different colormaps and intensity limits options, viewer(t1_data, index=250, view='axial', cmap='gray'):
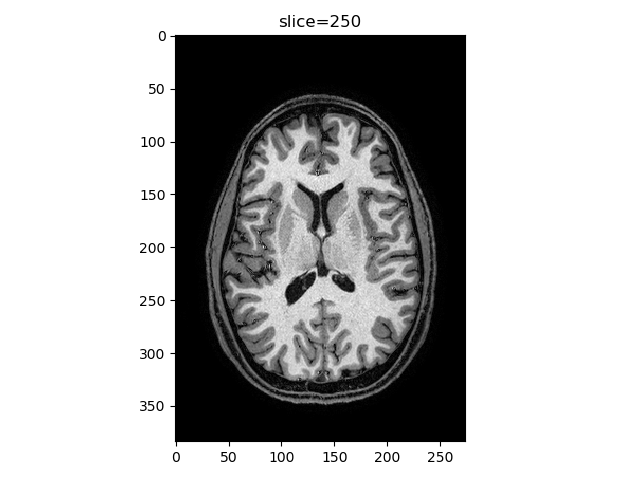
viewer(t1_data, index=250, view='axial', cmap='jet')
viewer(t1_data, index=250, view='axial', cmap='hot')

viewer(t1_data, index=250, view='axial', vmin=20, vmax=60)
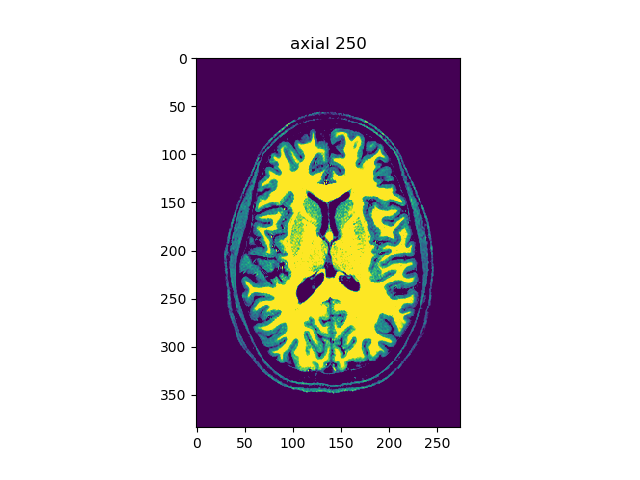
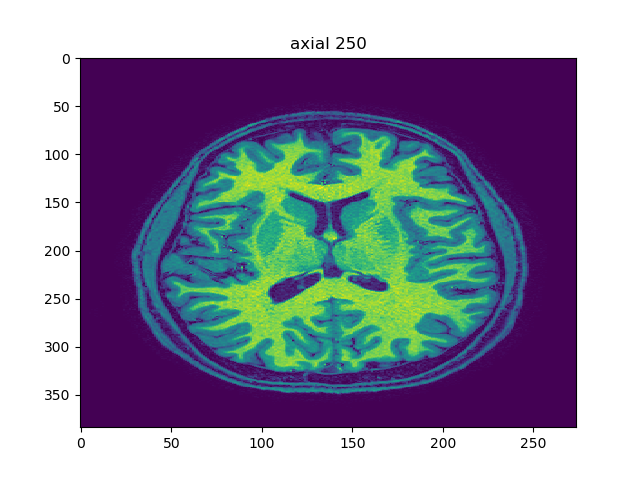
viewer(t1_data, index=250, view='axial', aspect='auto')
Modalities and frequency-domain filtering
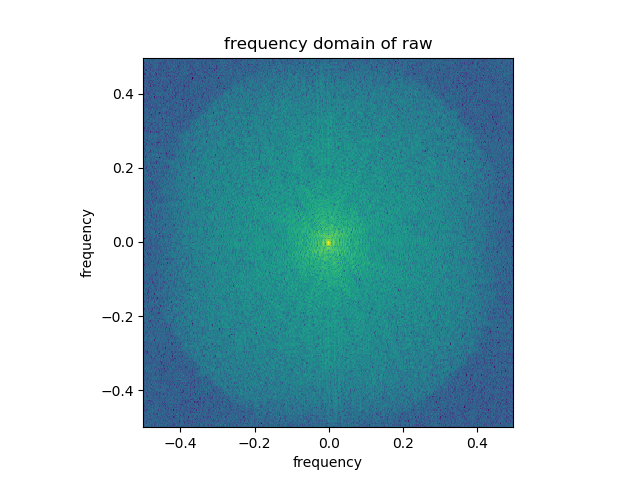
Smoothing and edge-detection are fundamental image processing operations. Here we use fft functions in numpy to perform edge detection and smoothing on 3D images in the frequency domain. Do a simple 2D FFT on one of the z-slices (axial slice) and display the result. Here uses fftshift and the logarithm to correctly visualize the fft. It looks like below using t2.nii, viewer(t2_data, index=250, view='axial'):

viewer(t2_data, index=250, view='axial', fft=True)
Generate frequency-domain gaussian filter using meshgrid and use to do frequency space filtering. Generating filters for 5 different sigmas using the following code:
# Gaussian filter
def gaussian_kernel(size, sigma=10, ptype='low', dim=2, verbose=False):

    if dim == 1:
        norm_v = np.vectorize(lambda x: np.exp(-(x/sigma)**2 / 2) /\
                              (np.sqrt(2*np.pi)*sigma))
        kernel = norm_v(np.linspace(-size // 2, size // 2, size))
    elif dim == 2:
        sz_x, sz_y = size
        X, Y = np.mgrid[:sz_x, :sz_y]
        xpr = X - int(sz_x) // 2
        ypr = Y - int(sz_y) // 2
        kernel = np.exp(-((xpr**2+ypr**2) / (2*sigma**2))) / (2*np.pi*sigma**2)

    if ptype == 'high':
        kernel = 1 - kernel

    if verbose:
        plt.title('sigma=%d' % sigma)
        if dim == 1:
            plt.plot(kernel)
        elif dim == 2:
            plt.imshow(kernel)

    return kernel
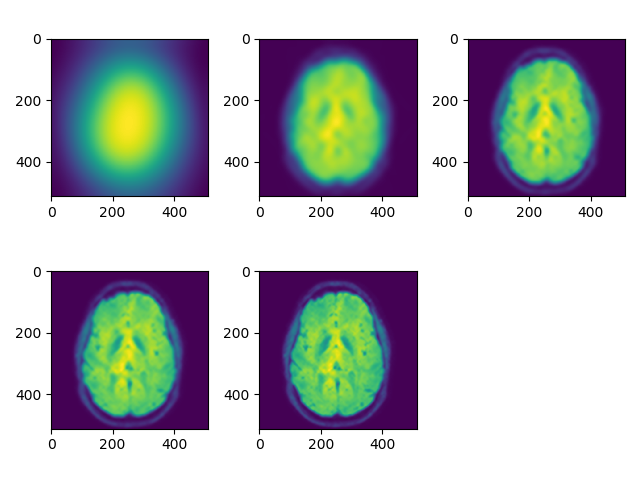
Below is the corresponding image after multiplying the above filter with the Fourier transform of raw and then inverting the Fourier transform on the swi.nii imaging modality:
# load swi
swi_data = nib.load('images/swi.nii').get_fdata()

# Gaussian blur
rotim = viewer(swi_data, index=250, view='axial', fft=True, ret_val=True)

count = 1
for sigma in range(1, 25, 5):
    gaussfilt = gaussian_kernel(rotim.shape, sigma=sigma)
    plt.subplot(2, 3, count)
    plt.imshow(np.abs(np.fft.ifft2(np.fft.ifftshift(gaussfilt*rotim))))
    count += 1
plt.suptitle('Gaussian blur')
plt.tight_layout()
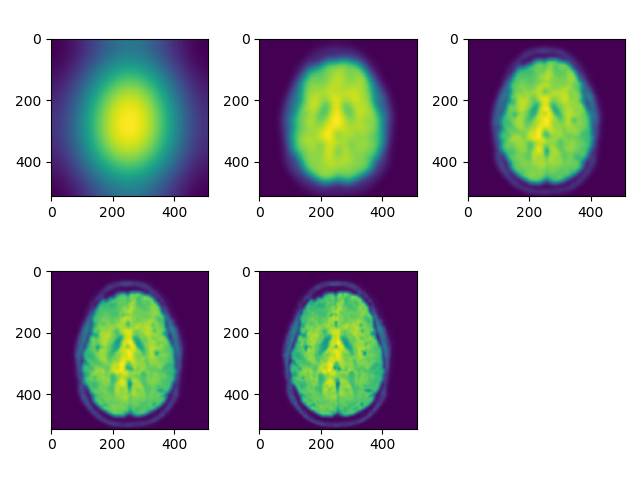
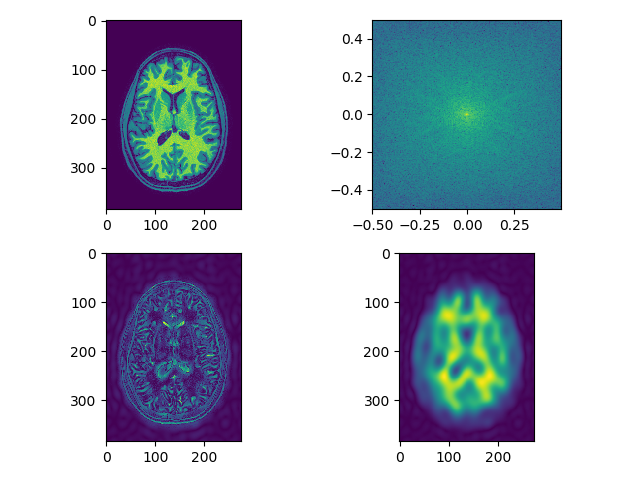
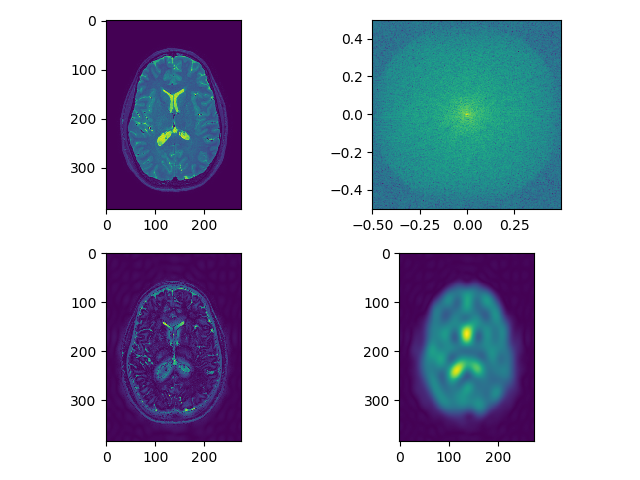
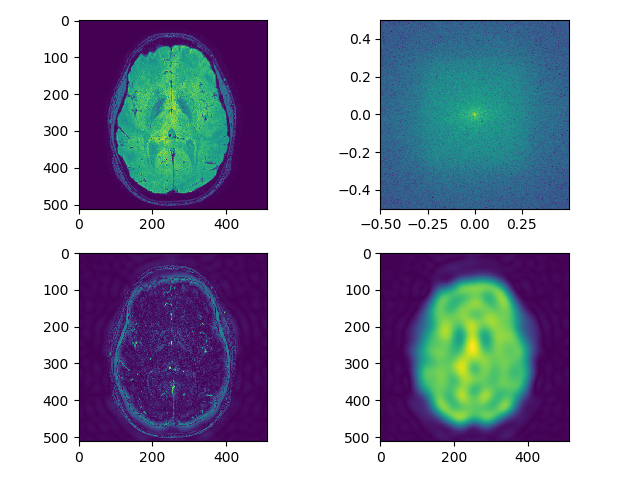
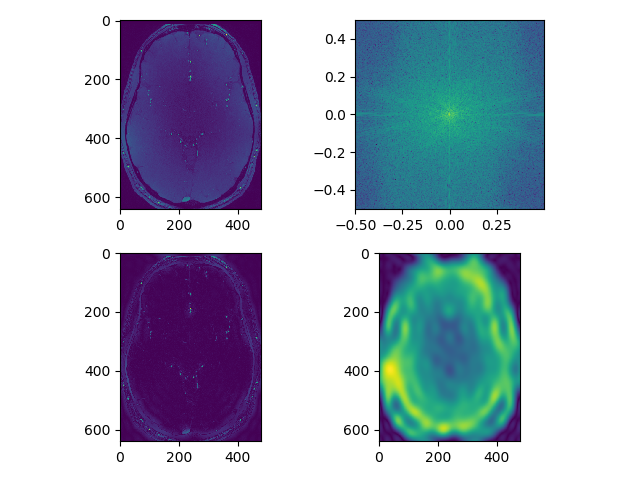
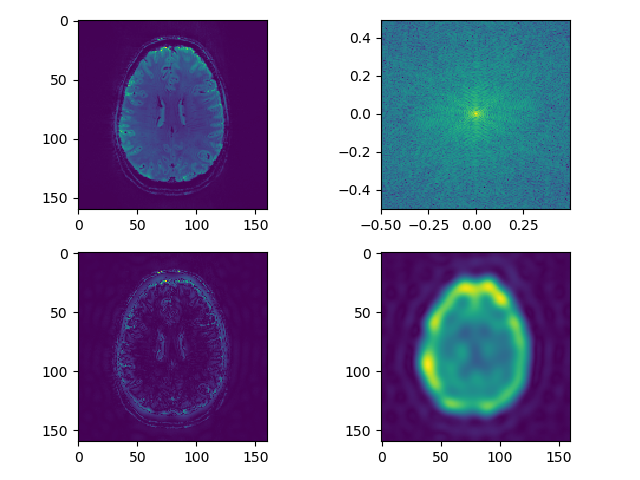
Load and display each modality in viewer. Perform smoothing as above and also edge detection using frequency domain filtering on each modality, can use fftn, or just do a 2D version and show a single slice. Let’s show the result as 5 separate plots (1 for each modality), each plot has 4 sub-plots:
- raw image (single slice)
- fft (raw image) – shown as above
- raw image after edge enhancement using frequency domain filtering (edge detection filter)
- raw image after smoothing using frequency domain filtering (use filters defined as above)
# Circular pass filter mask
def cpf(size, r=10, ptype='high', verbose=False):
    rows, cols = size
    crow, ccol = int(rows / 2), int(cols / 2)

    cntr = [crow, ccol]
    x, y = np.ogrid[:rows, :cols]

    if ptype == 'band':
        mask_area = np.logical_and(((x-cntr[0])**2 + (y-cntr[1])**2 >= r[0]**2),
                                   ((x-cntr[0])**2 + (y-cntr[1])**2 <= r[1]**2))
    else:
        mask_area = (x - cntr[0]) ** 2 + (y - cntr[1]) ** 2 <= r**2

    if ptype == 'high':
        mask = np.ones((rows, cols))
        mask[mask_area] = 0
    elif ptype == 'low' or ptype == 'band':
        mask = np.zeros((rows, cols))
        mask[mask_area] = 1

    if verbose:
        plt.imshow(mask)
        plt.title("Pass filter")

    return mask

def separate_axial(data, index=250):
    # raw image
    plt.subplot(221)
    plt.imshow(np.rot90(data[:, :, index]))

    # fft
    plt.subplot(222)

    rotim = np.fft.fftshift(np.rot90(np.fft.fftn(data, axes=(0,1))[:, :, index]))
    freq_x = np.fft.fftfreq(rotim.shape[0])
    freq_y = np.fft.fftfreq(rotim.shape[1])

    plt.imshow(np.abs(np.log(rotim)), extent=(freq_x.min(), freq_x.max(),
                                           freq_y.min(), freq_y.max()))

    # edge enhancement
    plt.subplot(223)
    hpf = cpf(rotim.shape, ptype='high')
    plt.imshow(np.abs(np.fft.ifft2(np.fft.ifftshift(hpf*rotim))))

    # smoothing
    plt.subplot(224)
    lpf = cpf(rotim.shape, ptype='low')
    plt.imshow(np.abs(np.fft.ifft2(np.fft.ifftshift(lpf*rotim))))

    plt.suptitle('axial %d' % index)
    plt.tight_layout()

# separate plot t1
separate_axial(t1_data, index=250)
# separate plot t2
separate_axial(t2_data, index=250)
# separate plot swi
separate_axial(swi_data, index=250)

# load tof
tof_data = nib.load('images/tof.nii').get_fdata()
# separater plot tof
separate_axial(tof_data, index=50)

# load bold
bold_data = nib.load('images/bold.nii').get_fdata()
# separate plot bold
separate_axial(bold_data, index=30)
Now experiment with different filter shape. Use a bar or a square, instead of a Gaussian smooth. Use square filter to multiply fourier transform of the image:
def square_kernel(size, a=21, ptype='low', verbose=False):
    rows, cols = size
    xline = np.ones(rows)
    yline = np.ones(cols)
    xf = gaussian_kernel(rows, sigma=a, dim=1, ptype=ptype)
    yf = gaussian_kernel(cols, sigma=a, dim=1, ptype=ptype)
    xkernel = np.outer(xline.T, yf.T)
    ykernel = np.outer(xf.T, yline.T)
    kernel = np.minimum(xkernel, ykernel)

    if verbose:
        plt.imshow(kernel)
        plt.title("Square filter")

    return kernel

rotim = viewer(swi_data, index=250, view='axial', fft=True, ret_val=True)
freq_x = np.fft.fftfreq(rotim.shape[0])
freq_y = np.fft.fftfreq(rotim.shape[1])

count = 1
for a in range(1, 25, 5):
    plt.subplot(2, 3, count)
    plt.imshow(square_kernel(rotim.shape, a=a),
               extent=(freq_x.min(), freq_x.max(), freq_y.min(), freq_y.max()))
    count += 1
plt.suptitle('Square filter')
plt.tight_layout()

# Square blur

count = 1
for a in range(1, 25, 5):
    sfilt = square_kernel(rotim.shape, a=a)
    plt.subplot(2, 3, count)
    plt.imshow(np.abs(np.fft.ifft2(np.fft.ifftshift(sfilt*rotim))))
    count += 1
plt.suptitle('Square filter smoothing')
plt.tight_layout()

