Pattern Recognition
Bayesian decision theory
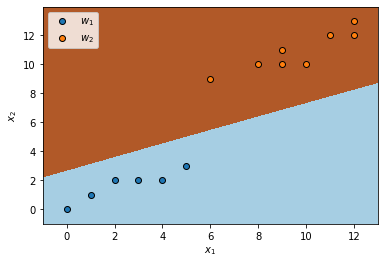
Consider the two-dimensional data points from two classes \(\omega_1\) and \(\omega_2\) below, and each of them come from a Gaussian distribution \(p(x\mid\omega_k)\sim \mathcal{N}(\mu_k, \Sigma_k)\)
| \(\omega_1\) | \(\omega_2\) |
| (0,0) | (6,9) |
| (1,1) | (8,10) |
| (2,2) | (9,10) |
| (3,2) | (9,11) |
| (4,2) | (10,10) |
| (5,3) | (11,12) |
| (12,12) | |
| (12,13) |
- The prior probability of each class, \(P(\omega_1)\) and \(P(\omega_2)\) are:
import numpy as np
import matplotlib.pyplot as plt
from sklearn.discriminant_analysis import QuadraticDiscriminantAnalysis

w1 = np.array([[0, 0], [1, 1], [2, 2], [3, 2], [4, 2], [5, 3]])
w2 = np.array([[6, 9], [8, 10], [9, 10], [9, 11], [10, 10], [11, 12], [12, 12], [12, 13]])

x = np.concatenate((w1, w2))
y = np.concatenate((np.zeros(len(w1)), np.ones(len(w2))))

qda = QuadraticDiscriminantAnalysis(store_covariance=True)
qda.fit(x, y)

print(qda.priors_)
[0.42857143 0.57142857]
- The mean \(\mu_k\) for each class is:
print(qda.means_)
[[ 2.5         1.66666667]
 [ 9.625      10.875     ]]
- The covariance matrix \(\Sigma_k\) for each class is:
for cov in qda.covariance_:
    print(cov)
[[3.5        1.8       ]
 [1.8        1.06666667]]
[[4.26785714 2.51785714]
 [2.51785714 1.83928571]]
- The decision boundary that separates the two classes draw as:
buffer = 1

x1min, x1max = x[:, 0].min() - buffer, x[:, 0].max() + buffer
x2min, x2max = x[:, 1].min() - buffer, x[:, 1].max() + buffer
step = .02
xx1, xx2 = np.meshgrid(np.arange(x1min, x1max, step), np.arange(x2min, x2max, step))
z = qda.predict(np.c_[xx1.ravel(), xx2.ravel()])

z = z.reshape(xx1.shape)

plt.pcolormesh(xx1, xx2, z, cmap=plt.cm.Paired)

plt.scatter(w1[:, 0], w1[:, 1], label='$w_1$', edgecolors='k')
plt.scatter(w2[:, 0], w2[:, 1], label='$w_2$', edgecolors='k')
plt.xlabel('$x_1$')
plt.ylabel('$x_2$')
plt.legend()

plt.xlim(xx1.min(), xx1.max())
plt.ylim(xx2.min(), xx2.max())

plt.show()
Parametric models
Consider Gaussian density models in different dimensions as following:
import numpy as np

w1 = np.array([(0.42, -0.087, 0.58),
      (-0.2, -3.3, -3.4),
      (1.3, -0.32, 1.7),
      (0.39, 0.71, 0.23),
      (-1.6, -5.3, -0.15),
      (-0.029, 0.89, -4.7),
      (-0.23, 1.9, 2.2),
      (0.27, -0.3, -0.87),
      (-1.9, 0.76, -2.1),
      (0.87, -1.0, -2.6)])

w2 = np.array([(-0.4, 0.58, 0.089),
      (-0.31, 0.27, -0.04),
      (0.38, 0.055, -0.035),
      (-0.15, 0.53, 0.011),
      (-0.35, 0.47, 0.034),
      (0.17, 0.69, 0.1),
      (-0.011, 0.55, -0.18),
      (-0.27, 0.61, 0.12),
      (-0.065, 0.49, 0.0012),
      (-0.12, 0.054, -0.063)])

w3 = np.array([(0.83, 1.6, -0.014),
      (1.1, 1.6, 0.48),
      (-0.44, -0.41, 0.32),
      (0.047, -0.45, 1.4),
      (0.28, 0.35, 3.1),
      (-0.39, -0.48, 0.11),
      (0.34, -0.079, 0.14),
      (-0.3, -0.22, 2.2),
      (1.1, 1.2, -0.46),
      (0.18, -0.11, -0.49)])
- Find the maximum likelihood values \(\hat{\mu}\) and \(\hat{\sigma}^2\) for each of the three features \(x_i\) individually of category \(\omega_1\) above:
print(w1.mean(0))
[-0.0709 -0.6047 -0.911 ]
print(w1.var(0))
[0.90617729 4.20071481 4.541949 ]
- Apply two-dimensional Gaussian data \(p(x)\sim \mathcal{N}(\mu, \Sigma)\) to each of the three possible pairings of two features for \(\omega_1\):
from sklearn.covariance import EmpiricalCovariance
cov = EmpiricalCovariance()

cov.fit(w1[:, :-1])
print(cov.location_)
print(cov.covariance_)
[-0.0709 -0.6047]
[[0.90617729 0.56778177]
 [0.56778177 4.20071481]]
cov.fit(w1[:, 1:])
print(cov.location_)
print(cov.covariance_)
[-0.6047 -0.911 ]
[[4.20071481 0.7337023 ]
 [0.7337023  4.541949  ]]
cov.fit(w1[:, [0,-1]])
print(cov.location_)
print(cov.covariance_)
[-0.0709 -0.911 ]
[[0.90617729 0.3940801 ]
 [0.3940801  4.541949  ]]
- Apply to full three-dimensional Gaussian data for \(\omega_1\):
cov.fit(w1)
print(cov.location_)
[-0.0709 -0.6047 -0.911 ]
print(cov.covariance_)
[[0.90617729 0.56778177 0.3940801 ]
 [0.56778177 4.20071481 0.7337023 ]
 [0.3940801  0.7337023  4.541949  ]]
- Assume the three-dimensional model is separable, so that \(\Sigma = \text{diag}(\sigma_1^2, \sigma_2^2, \sigma_3^2)\). Estimate the mean and the diagonal components of \(\Sigma\) in data \(\omega_2\):
print(w2.mean(0))
[-0.1126 0.4299 0.00372]
print(np.diag(w2.var(0)))
[[0.05392584 0.         0.        ]
 [0.         0.04597009 0.        ]
 [0.         0.         0.00726551]]
EM algorithm
Use same data points above, suppose that ten data points in category \(\omega_1\) come from a three-dimensional Gaussian. However, there is no access to the \(x_3\) components for the even-numbered data points.
import numpy as np

w1m = np.array([[0.42, -0.087, 0.58],
      [-0.2, -3.3, np.nan],
      [1.3, -0.32, 1.7],
      [0.39, 0.71, np.nan],
      [-1.6, -5.3, -0.15],
      [-0.029, 0.89, np.nan],
      [-0.23, 1.9, 2.2],
      [0.27, -0.3, np.nan],
      [-1.9, 0.76, -2.1],
      [0.87, -1.0, np.nan]])
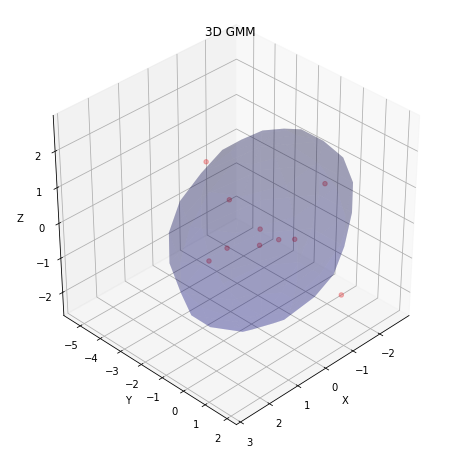
- Use EM algorithm to estimate the mean and covariance of the distribution. Start estimation with \(\mu_0=0\) and \(\Sigma=I\), the three-dimensional identity matrix (for the missing \(x_3\), simply attribute the value \(\frac{x_1+x_2}{2}\)):
w1m[np.isnan(w1m)] = w1m[:,:2].mean(1)[np.isnan(w1m[:,-1])]

from sklearn.mixture import GaussianMixture

gmm = GaussianMixture(means_init=[np.zeros(w1m.shape[1])], precisions_init=[np.identity(w1m.shape[1])])

gmm.fit(w1m)
print(gmm.means_)
[[-0.0709 -0.6047 0.446 ]]
print(gmm.covariances_)
[[[0.90617829 0.56778177 0.707406  ]
  [0.56778177 4.20071581 0.4143502 ]
  [0.707406   0.4143502  1.150433  ]]]
- Display the obtained result in form of clusters:
import matplotlib.pyplot as plt
import matplotlib.cm as cmx

def visualize_3d_gmm(points, w, mu, stdev):

    n_gaussians = mu.shape[1]
    N = int(np.round(points.shape[0] / n_gaussians))

    fig = plt.figure(figsize=(8, 8))
    axes = fig.add_subplot(111, projection='3d')
    plt.set_cmap('Set1')
    colors = cmx.Set1(np.linspace(0, 1, n_gaussians))
    for i in range(n_gaussians):
        idx = range(i * N, (i + 1) * N)
        axes.scatter(points[idx, 0], points[idx, 1], points[idx, 2], alpha=0.3, c=[colors[i]])
        plot_sphere(w=w[i], c=mu[:, i], r=stdev[:, i], ax=axes)

    plt.title('3D GMM')
    axes.set_xlabel('X')
    axes.set_ylabel('Y')
    axes.set_zlabel('Z')
    axes.view_init(35.246, 45)

    plt.show()

def plot_sphere(w=0, c=[0,0,0], r=[1, 1, 1], subdev=10, ax=None, sigma_multiplier=3):

    if ax is None:
        fig = plt.figure()
        ax = fig.add_subplot(111, projection='3d')
    pi = np.pi
    cos = np.cos
    sin = np.sin
    phi, theta = np.mgrid[0.0:pi:complex(0,subdev), 0.0:2.0 * pi:complex(0,subdev)]
    x = sigma_multiplier*r[0] * sin(phi) * cos(theta) + c[0]
    y = sigma_multiplier*r[1] * sin(phi) * sin(theta) + c[1]
    z = sigma_multiplier*r[2] * cos(phi) + c[2]
    cmap = cmx.ScalarMappable()
    cmap.set_cmap('jet')
    c = cmap.to_rgba(w)

    ax.plot_surface(x, y, z, color=c, alpha=0.2, linewidth=1)

    return ax
visualize_3d_gmm(w1m, gmm.weights_, gmm.means_.T, np.sqrt(gmm.covariances_).T)
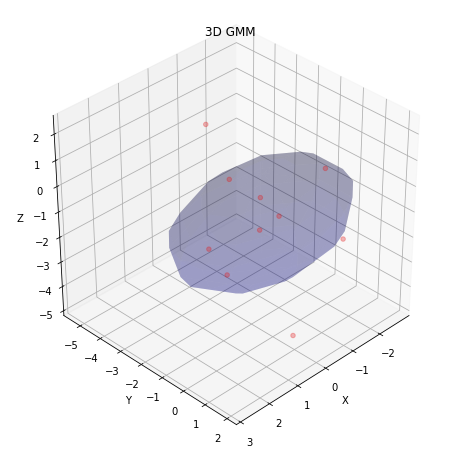
- Compare final estimate with the case when there is no missing data:
w1 = np.array([(0.42, -0.087, 0.58),
      (-0.2, -3.3, -3.4),
      (1.3, -0.32, 1.7),
      (0.39, 0.71, 0.23),
      (-1.6, -5.3, -0.15),
      (-0.029, 0.89, -4.7),
      (-0.23, 1.9, 2.2),
      (0.27, -0.3, -0.87),
      (-1.9, 0.76, -2.1),
      (0.87, -1.0, -2.6)])

gmm.fit(w1)
print(gmm.means_)
[[-0.0709 -0.6047 -0.911 ]]
print(gmm.covariances_)
[[[0.90617829 0.56778177 0.3940801 ]
  [0.56778177 4.20071581 0.7337023 ]
  [0.3940801  0.7337023  4.54195   ]]]
- Display the obtained result in form of clusters:
visualize_3d_gmm(w1, gmm.weights_, gmm.means_.T, np.sqrt(gmm.covariances_).T)
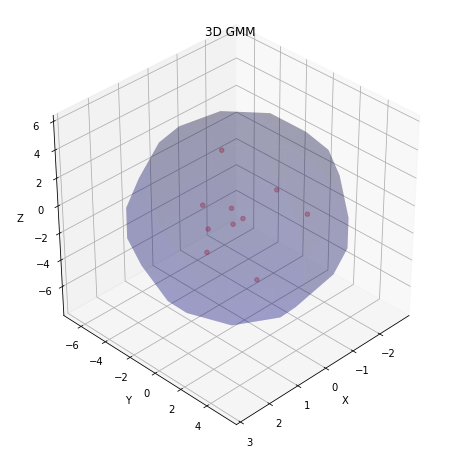
- Compare final estimate with that for the case when there is no missing data in the case of diagonal covariance:
gmm = GaussianMixture(covariance_type='diag', means_init=[np.zeros(w1.shape[1])], precisions_init=[np.ones(w1.shape[1])])
gmm.fit(w1)
[[-0.0709 -0.6047 -0.911 ]]
print(gmm.covariances_)
[[0.90617829, 4.20071581, 4.54195 ]]
- Display the obtained result in form of clusters:
visualize_3d_gmm(w1, gmm.weights_, gmm.means_.T, np.sqrt(gmm.covariances_).T)
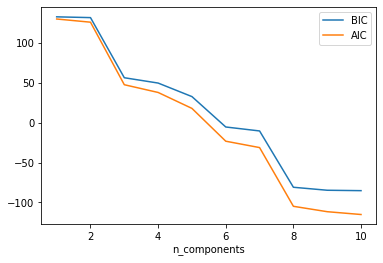
- Draw the Akaike information criterion (AIC) and Bayesian information criterion (BIC) curves for this dataset:
def testGMMsklearnBICAIC(data, n_gaussian):
    n_components = np.arange(1, n_gaussian+1)
    clfs = [GaussianMixture(n).fit(data) for n in n_components]
    bics = [clf.bic(data) for clf in clfs]
    aics = [clf.aic(data) for clf in clfs]

    plt.plot(n_components, bics, label = 'BIC')
    plt.plot(n_components, aics, label = 'AIC')
    plt.xlabel('n_components')
    plt.legend()
    plt.show()

testGMMsklearnBICAIC(w1, 10)
Non-Parametric Methods
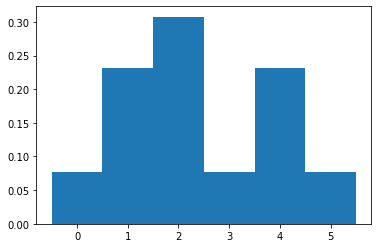
Given a dataset \(D=\{0,1,1,1,2,2,2,2,3,4,4,4,5\}\). Use techniques from parametric and non-parametric density estimation.
import numpy as np

D = np.array([0,1,1,1,2,2,2,2,3,4,4,4,5])
- Draw histogram of \(D\) with bin width of 1 and bins centered at \(\{0,1,2,3,4,5\}\):
import matplotlib.pyplot as plt

plt.hist(D, bins=np.arange(D.max()-D.min()+2)-0.5, density=True)
plt.show()
- Select a triangle kernel as window function — \(K(u)=(1-\mathopen\mid u\mathclose\mid)\delta(\mathopen\mid u\mathclose\mid\leq1)\), where \(u\) is a function of the distance of sample \(x_i\) to the value in \(x\) divided by the bandwidth — \(u=\frac{x-x_i}{h}\). Compute the kernel density estimates for the following values of \(x=\{0,1,2,3,4,5\}\) with bandwidth of 2:
def p(x, X=D, h=2):
    K = lambda t: 1/h**X.ndim * (1-np.abs((x-t)/2)) * (np.abs((x-t)/2) <= 1)
    return np.vectorize(K)(X).sum() / X.size

x = np.arange(D.max()+1)
p = np.vectorize(p)(x)
print(p)
[0.09615385 0.21153846 0.23076923 0.17307692 0.15384615 0.09615385]
- Assume the density is a parametric desity — Gaussian. Compute the maximum likelihood estimate of the Gaussian’s parameters:
mu = D.mean()
print(mu)
2.3846153846153846
print(D.var())
2.082840236686391
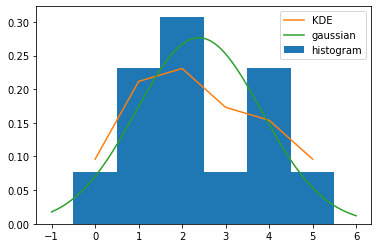
- Compare the histogram, the triangle-kernel density estimate, and the maximum-likelihood estimated Gaussian:
from scipy.stats import norm

plt.hist(D, bins=np.arange(D.max()-D.min()+2)-0.5, density=True, label='histogram')
plt.plot(p, label='KDE')
x_axis = np.arange(D.min()-1, D.max()+1, 0.001)
plt.plot(x_axis, norm.pdf(x_axis,mu,D.std()), label='gaussian')
plt.legend()
plt.show()
Dimensionality Reduction
Test three dimensionality reduction methods by using a real dataset. Iris dataset also known as Fisher’s Iris is a multivariate dataset presented in 1936 by Ronald Fisher in his paper entitled by “The use of multiple measurements in taxonomic problems as an application example of linear discriminant analysis”. The dataset includes 50 samples from each of the three iris species (Iris setosa, Iris virginica and Iris versicolor). Four features were measured from each sample: the length and width of the sepals and petals, in centimeters. Illustrate in 2D and in 3D the features’ reduction of Iris dataset with the following three dimensionality reduction methods:
- Principal Component Analysis;
- Isometric Mapping;
- Locally linear embedding.
from sklearn import datasets

iris = datasets.load_iris()
X = iris.data
y = iris.target

from sklearn.decomposition import PCA
from sklearn.manifold import Isomap
from sklearn.manifold import LocallyLinearEmbedding

def PCAProjection(myArray, dim):
    return PCA(n_components=dim).fit_transform(myArray)

def ISOMAPProjection(myArray, dim):
    return Isomap(n_components=dim).fit_transform(myArray)

def LLEProjection(myArray, dim):
    return LocallyLinearEmbedding(n_components=dim).fit_transform(myArray)
fig, axes = plt.subplots(1, 3, figsize=(15, 5))
X_reduced = PCAProjection(X, 2)
axes[0].scatter(X_reduced[:, 0], X_reduced[:, 1], c=y, cmap=plt.cm.Set1, edgecolor='k')
axes[0].set_title('PCA')
axes[0].set_yticklabels([])
axes[0].set_xticklabels([])
X_reduced = ISOMAPProjection(X, 2)
axes[1].scatter(X_reduced[:, 0], X_reduced[:, 1], c=y, cmap=plt.cm.Set1, edgecolor='k')
axes[1].set_title('IsoMap')
axes[1].set_yticklabels([])
axes[1].set_xticklabels([])
X_reduced = LLEProjection(X, 2)
axes[2].scatter(X_reduced[:, 0], X_reduced[:, 1], c=y, cmap=plt.cm.Set1, edgecolor='k')
axes[2].set_title('LLE')
axes[2].set_yticklabels([])
axes[2].set_xticklabels([])
plt.tight_layout()
plt.show()

from mpl_toolkits import mplot3d

fig = plt.figure(figsize=(20, 6))
ax = fig.add_subplot(1, 3, 1, projection='3d')
X_reduced = PCAProjection(X, 3)
ax.scatter(X_reduced[:, 0], X_reduced[:, 1], X_reduced[:, 2], c=y, cmap=plt.cm.Set1, edgecolor='k')
ax.set_title('PCA')
ax.set_zticklabels([])
ax.set_yticklabels([])
ax.set_xticklabels([])
ax = fig.add_subplot(1, 3, 2, projection='3d')
X_reduced = ISOMAPProjection(X, 3)
ax.scatter(X_reduced[:, 0], X_reduced[:, 1], X_reduced[:, 2], c=y, cmap=plt.cm.Set1, edgecolor='k')
ax.set_title('IsoMap')
ax.set_zticklabels([])
ax.set_yticklabels([])
ax.set_xticklabels([])
ax = fig.add_subplot(1, 3, 3, projection='3d')
X_reduced = LLEProjection(X, 3)
ax.scatter(X_reduced[:, 0], X_reduced[:, 1], X_reduced[:, 2], c=y, cmap=plt.cm.Set1, edgecolor='k')
ax.set_title('LLE')
ax.set_zticklabels([])
ax.set_yticklabels([])
ax.set_xticklabels([])
plt.tight_layout()
plt.show()
